

It is often touted that BTC is a good way to diversify your portfolio as being over 11 years since it started trading, BTC has almost zero correlation with equities if you were to compare it with the S&P500. However, BTC price fell considerably in March 2020, as did the S&P500, but since then this asset has outperformed the S&P500 as its correlation returns to norm i.e. zero. Will we see other quoted companies follow MicroStrategy which has recently bought BTC since it believes BTC will be a better store of value than $? If this happens equity indices are likely to have a much closer correlation between with BTC as the underlying constituents will be exposed to BTC. According to Seeking Alpha, “MicroStrategy now offers a remarkable opportunity to gain indirect exposure to Bitcoin with limited downside and still offering significant upside. To conservative investors wanting Bitcoin exposure, the 30% downside on if BTC goes to ZERO but a gain of 240% if BTC rises to $100,000.”
Bitcoin correlation with S&P 500 (30-day rolling average)
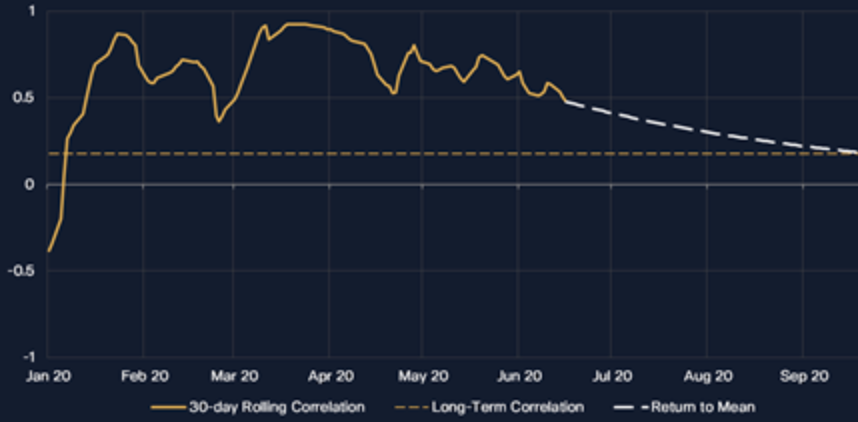
Source:Inva.com
A challenge for investors looking for exposure to crypto currencies is the dominance of BTC. It accounts for 63% of the entire capitalisation of the crypto currencies market as it can be traded physically, over the counter, via a fund or via futures contracts, all of which many other cryptos cannot. If BTC rises, as has been the case this year, then many other cryptos have tended to rise as well. Historically, this had equally been the case because many cryptos carried out Initial Coin Offerings (ICOs) and were funded by investors using BTC as opposed to cash. An example of this is Electroneum (ETN) which did an ICO attracting 112,000 participants (the largest ever number for an ICO) and ETN still holds a considerable number of Bitcoin
In the equity market the situation is potentially no better. There has been a vast amount of money flowing into index funds and ETFs, partially due to the lower fees they charge compared to active fund alternatives. Passive funds have also performed better in many instances. According to Morningstar’s (a funds rating and analytics business) reports in the last ten years, “just 23% of active funds managed to both survive and to outperform their passive peers. The likelihood and performance penalty for picking an underperforming manager tends to be greater than the probability and reward for finding a winner.” However, one of the downsides of buying a fund that tracks an index can also be the risk of being overexposed to a handful of stocks. For example, only 5 companies Apple, Microsoft, Amazon, Facebook and Google (which is quoted as Alphabet) account for over 40% of the capitalisation of the NASDAQ index. The S&P500, which represents the 500 most valuable equities traded in the US, is dominated by four stocks, Facebook, Amazon Netflix, Google.
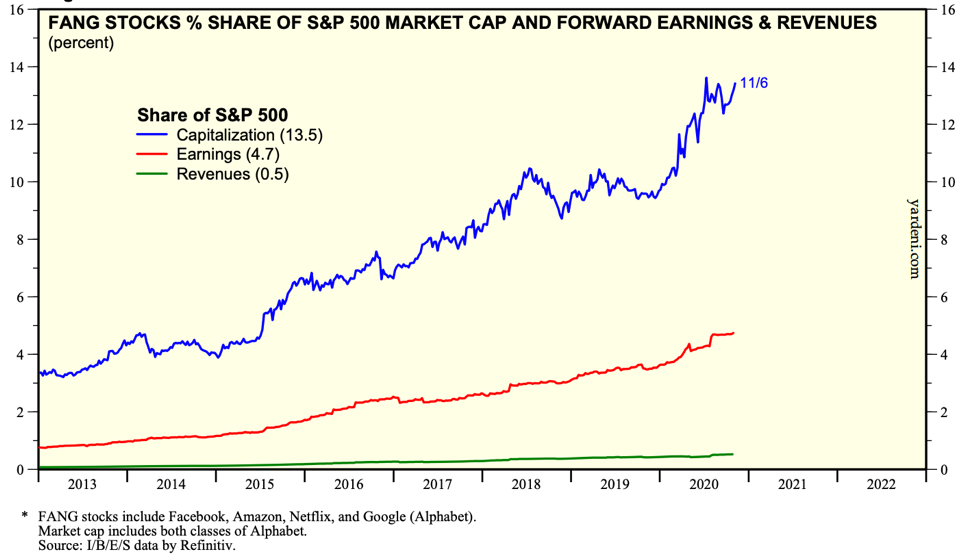
Source: Yardeni.com
These stocks account for over 13% of the entire market capitalisation, so hardly a great way to be diversified. What is worrying is, if you look at the FANG’s earnings, they only account for 4.7% of the S&P500. An even more extreme situation can be seen in China where only three shares in the benchmark MSCI China Index account for more than 38% of the index. These equities are China’s version of FANG - Alibaba, Tencent and food delivery firm, Meituan Dianping (otherwise collectively known as ATM).
Whether you are investing in a stock such as MicroStrategy, buying one of the increasing number of crypto funds that are being launched, many of which often have a large exposure to BTC or are buying an Exchange Traded Fund (ETF) linked to an index such as Nasdaq or MSCI China, ensure you know what you are really exposed to and how diversified your holdings really are.